Want to learn how to measure your blog performance? Here are examples of the 3 best Google Analytics dashboards every blogger should know about.

Growing and sustaining your blog is not the game for the weak minds. You have to make changes to your website to win the game. As a blogger, I used 3 main types of reports under Google Analytics Explorations.
You will learn about Google Analytics Explore reports, how to use GA4 explorations, and analytics dashboard examples such as free-form exploration, path exploration, and funnel exploration.
By the end of the post, you should be able to create your analytics dashboards in GA4 explorations and start analysing them today.
This post will be all about creating the best Google Analytics dashboards in Explorations.
Google Analytics Explorations
While Google Analytics reports can provide a lot of information about your blog performance, Google Analytics Explorations offers more customization and flexibility, allowing us to dig deep into the data.

This is where you can explore your data in detail and answer complicated questions that you may have for your blog.
Google Analytics Dashboard Templates
Under Explorations > Template gallery, there are a variety of templates that you can use at your fingertips to analyse your blog data.

In the template gallery, you should find 3 different types of templates – Techniques, Use Cases, and Industries.


The most commonly used templates are free-form, funnel exploration, and path exploration, which I will be bringing you through.
I like to start a new exploration with a blank.
Google Analytics Explore Reports Interface
Once you create a new report, this is what you should see.

Zooming into the first section “Variables”.
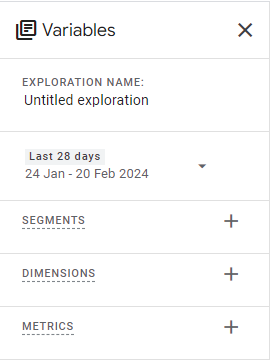
Here, you will see 5 main things:
- Exploration Name – This is the name of your dashboard
- Date – This is the timeframe of the data that you wish to see
- Segments – A particular group of group you want to zoom in on
- Dimensions – Attributes of your data
- Metrics – The measurements
This section is where you add in all the segments, dimensions, and metrics you are using in your visualisation.
The next section is “Settings”.

This is where you drag and drop the variables you added to create your tables and charts. You set up your analysis parameters such as the techniques, graph types, segments, dimensions, metrics, and filters here.
Take note that the “settings” only display the setup of your current analysis tab. You can create up to 10 tabs in a single Explore report.
Resource for you: [GA4] Get started with Explorations
Free Form Exploration
I will be going through 3 free-form explorations that I used for my blog through demo videos so you can follow along.
I will be censoring the data but the steps are the same.
Blog Traffic Report
The first step to creating any dashboard is to add in your dimensions and metrics, before dragging into the tab.
You should be able to find them quickly using the search bar if you know exactly what you are looking for. If you are doing exploratory analysis, you have the option to scroll through the dimensions and metrics.
Blog Performance Report
To create a new dashboard, the first way is to go to the top tab, click “+” and add another free-form exploration.
Replicate what you did for the blog traffic report by dragging the dimensions and metrics into the settings.
Blog Demographics Report
The second way to create a new dashboard is to duplicate one of the current dashboards and make changes. You can easily cancel current dimensions and drag in new ones.
Resource for you: [GA4] Free-form exploration
GA4 Path Exploration
Next up, is path exploration, also known as path analysis. This exploration allows you to explore customer journeys in a tree graph using these dimensions:
- Event name
- Page title and screen name
- Page title and screen class
- Page path and screen class
I like to go with 1 or 2 as it is more user-friendly and more intuitive.

What’s super cool is that you can choose to start from the starting point or the ending point.
This is extremely useful as it covers more use cases with these 2 nature:
- You want to know where users go after visiting a specific blog post/ page
- You want to know where the user came from before landing on a specific blog post/ page

Another feature here is that you can switch between the dimensions here at every step, making the exploration process very versatile and fun.
Resources for you: [GA4] Path exploration
GA4 Funnel Exploration
Lastly, the funnel exploration allows you to visualise the steps the readers take to complete a task and the drop-off rate at each step. The funnel is most commonly used for e-commerce sites where business owners want to know where users are dropping off at the checkout funnel and customer acquisition funnel. If you are planning to sell digital products on your blog, this will be super useful.
3 most common metrics used here will be Users, Completion rate, and Abandonment rate.
For the breakdown dimension, you can drag in any dimension you wish to see. For instance, by device category, by gender, or even by channels.
There are 2 things you can play around with which I find will be beneficial for you to know.

For visualisation, you can choose between a standard or trended funnel. The difference between these is that a standard funnel is a bar chart while a trended funnel is a line chart.

The second thing you can play with is toggling the “Make open funnel”. Toggling it on will make it an open funnel while toggling it off will make it a closed funnel.
An open funnel is when users can enter the funnel at any step. Whereas, a closed funnel is when users must enter the funnel in the first step. Meaning that, if they do not fulfill the requirements of a step, they will fall out of the funnel and will not be included in the subsequent steps. They can only enter the funnel once.
Resources for you: [GA4] Funnel exploration

Don’t waste months trying to figure it out…
I spent 5 months trying and failing to make real progress before I finally took this course.
In just one month, my blog got monetized and I had more traction than I ever did before.
Trust me, your future self will thank you for starting sooner.
This post is all about customising your best Google Analytics dashboards to your blogging needs.
If you love to see more content like this, connect & follow me on social media to stay updated with the latest information.
Other posts you may like:
- 5 Best Google Analytics Report to Look at for Bloggers
- 4 Easy and Proven Steps to Set Up Free Google Analytics Plugin for WordPress
- 5 Simple Steps to Build The Best Dashboard Your Business Needs

Your Monthly Permission Slip to Play
Open a monthly bundle of keepsakes and a nostalgic time-capsule activity designed to give you a tiny, analog escape.


