Learn how to analyse your Etsy sales data. Tips from a digital consultant.

Analysing Etsy statistics doesn’t have to be hard. As an Etsy seller who has a background in analytics, I decided to write this post for those of you who are looking to analyse your Etsy sales data to grow your business.
You will learn about running an analysis process, the definition of Etsy stats, data collection, access to the Etsy analysis tool I have created, 8 Etsy analysis case studies, and more.
This post is all about analysing Etsy Sales Data.
Table of Content
- Objectives of the Blog Post
- Introduction to the Analysis Process
- Understanding the Etsy Customer Journey
- Etsy Stats Explained
- Collecting Etsy Shop Data
- Interactive Excel Template: The Etsy Seller’s Toolkit
- Turning Etsy Data into Insights
- Case Study 1: Analyse ASP and AOV trends
- Case Study 2: Evaluate ROI and Marketing Strategies
- Case Study 3: Explore Listing and Visits
- Case Study 4: Assess Conversion Rate
- Case Study 5: Analyse Marketing Channel Effectiveness
- Case Study 6: Explore Social Media Impact on Shop Visits
- Case Study 7: Compare CTR and C2O
- Case Study 8: Optimize Etsy Ads ROAS
- [Bonus] Uncover Additional Insights with Etsy Stats
- Explore Related Resources
Objectives of the Blog Post
In this post, I want to clarify what my goals are NOT:
- Providing guaranteed marketing strategies.
- Offering one-size-fits-all solutions.
- Giving specific recommendations for your Etsy shop.
Instead, I aim to teach you how to fish. I want to guide you in:
- Understanding the data you need to collect.
- Finding where to gather this data.
- Analysing your data and crafting a meaningful story.
By acquiring these skills and knowledge, you can make personalised, data-driven business decisions that will help your shop grow and thrive in the long run.
Introduction to the Analysis Process
Before we dive into the details, let’s explore what a typical analysis process entails and where our focus lies.
In the early stages of your business, it is vital to set clear objectives and collect data. Here’s a simplified breakdown of the analysis process:
- Define Scope and Plan: Your analysis journey begins by defining the scope and goals of your project. You need to know precisely what data you want to examine and what you aim to discover. Setting clear boundaries is crucial; otherwise, analysis can become an endless endeavour. Remember, in business, time is money, and we shouldn’t waste it on non-productive tasks.
- Data Collection: After outlining your project’s scope, you’ll start gathering the necessary data. Cleaning the data is an essential step, ensuring it’s in a format that’s easy to analyse. This might involve creating dashboards, tables, or Excel spreadsheets. In larger companies, such as SMEs or MNCs, they often invest in web analytics solutions with user-friendly interfaces for streamlined analysis.
- Data Analysis: With clean data in hand, it’s time to dive deep into the analysis process. This is where you extract insights from the data and craft a compelling narrative.
- Identify Opportunities: Once you can tell a story with the data, you’ll start identifying potential gaps and opportunities for your shop.
- Make Changes: After identifying opportunities, you devise a personalised strategy that is tailored to your shop’s unique needs. This strategy is all about what works best for your shop.
Once you have determined what needs to change, you will put your new business strategy into action. As the strategy unfolds, you will start collecting fresh data that provides new insights. This is the cycle of an entire analysis project, and each project can be different depending on your goals.
Understanding the Etsy Customer Journey
To guide you in defining project goals and objectives, let’s introduce the customer acquisition funnel:
- Awareness: When potential customers discover and become interested in your brand.
- Engagement: When customers become attracted and engaged with your brand.
- Conversion: When a customer makes a purchase.
- Retention: When a customer returns, and a lasting relationship develops.
As you go through this lifecycle, you can pinpoint the strategies to modify, and improve specific stages of the customer lifecycle, and set clear objectives. For instance, you might want to determine which social media platform generates more traffic and where to allocate marketing dollars.
Once you have identified your goal, such as “Which social media platform drives more traffic?” you can start defining Key Performance Indicators (KPIs) and decide what data to collect and where to find it. You will also plan your project timeline, allocate resources, and establish deliverables. The project duration typically ranges from 2 to 6 weeks, depending on its scale.
With all these preparations in place, you will be ready to move on to the next stage: data collection.
Etsy Stats Explained
Before we proceed, it is important to familiarise yourself with the definitions of key metrics and traffic sources.
Key Metrics
- Visits: The number of shop or listing views.
- Orders: The total orders in your shop.
- Revenue: The sales total minus shipping and tax expenses.
- Conversion Rate: The percentage of visitors who make a purchase, calculated as Conversion Rate = Number of Orders / Number of Visits.
Traffic Sources
- Etsy Search: Visits from internal Etsy searches.
- Advertising: Visits from ads on Etsy and Google.
- Marketing & SEO: Visits from Offsite Ads and SEO.
- Social Media: Visits from platforms like Instagram, Facebook, and Pinterest.
- Direct & Other Traffic: Visits from people who directly accessed your shop.
- Etsy App & Other Etsy Pages: Visits from Etsy’s app and other site pages.
- Etsy Ads: Visits from ads on Etsy.com.
- *Offsite Ads: Visits from Offsite Ads on external websites.
You can access Etsy’s glossary for more information on Etsy Metrics Definitions here
Collecting Etsy Shop Data
Many businesses have a web analytics solution, such as Google Analytics, Adobe Analytics, or Mixpanel, which offers user-friendly interfaces for tracking Key Performance Indicators (KPIs).
For this blog post’s purpose, I will use an Excel template I have prepared to illustrate and clarify the concepts. You can get your copy here.
For those of you who did not get your copy, this is the list of metrics and calculated metrics that I will be using.
| Metrics | Calculated Metrics |
| Total # of listings | Social Media Visits |
| Visits | Conversion |
| Etsy App Visits | Average Selling Price, ASP |
| Etsy Search Visits | Average Order Value, AOV |
| Etsy MKT & SEO Visits | Return on Ad Spend, ROAS |
| Direct Visits | Click through rate, CTR |
| Facebook Visits | Click-to-order rate, C2O |
| Instagram Visits | Listing Fee (new pdt only) |
| Pinterest Visits | Net Profit |
| Etsy Ads Visits | MISC FEES |
| Total Products Sold | Total Cost |
| Total Orders | Return on Investment, ROI |
| Total Revenue | |
| Ad Spend | |
| Ad Views | |
| Ad Clicks | |
| Ad Orders | |
| Actual Profit |
You can skip the next section if you don’t want to learn more about the Excel template.
Interactive Excel Template: The Etsy Seller’s Toolkit
Are you an Etsy seller keen on enhancing your data-driven decision-making? This Etsy analysis tool is designed to seamlessly complement this blog post.
Here are the benefits:
- ✅Easily track and interpret your Etsy performance data so you can make strategic adjustments.
- ✅Know exactly on how to improve your Etsy shop’s sales with actionable insights derived from your data.
- ✅Save time creating dashboard and spend more time analyzing your data
- ✅Enjoy a solution that is budget-friendly and maximizes your ROI.
Turning Etsy Data into Insights
In this section, we will explore 8 Etsy analysis case studies. Hypothetical data will be used to illustrate the use cases, demonstrating the thought process behind the analysis.
This approach will equip you with the skills to analyse your own Etsy shop data, make data-driven decisions, and guide your Etsy business toward greater success.
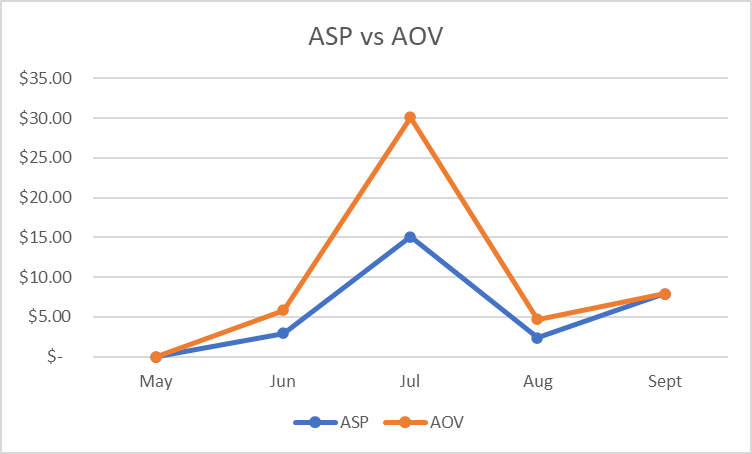
Case Study 1: Analyse ASP and AOV trends
In this case study, we are examining both the ASP and AOV to understand the dynamics of our shop’s pricing strategy. These KPIs give us insights into (1) Whether customers are purchasing smaller or larger-sized items, and (2) How price-sensitive your customers are.
BUSINESS QUESTIONS
- Which product is driving the most sales?
- What kind of products are driving the highest conversions?
- What product strategy should I adopt?
KPIs
- ASP
- AOV
RULE OF THUMB
- Analyse the overall trend.
- Identify the causes.
- Deep dive for insights
USE CASE:
If both ASP and AOV are on the rise, it may signal that customers are willing to pay more for the products, possibly due to improved quality or unique offerings. However, if ASP increases while AOV remains consistent or decreases, it could suggest that customers are buying more units of lower-priced items.
To gain deeper insights, deep dive into the cause of these trends and relate them to other shop activities during that period, like marketing pushes, product listings, or promotions, to make informed business decisions.
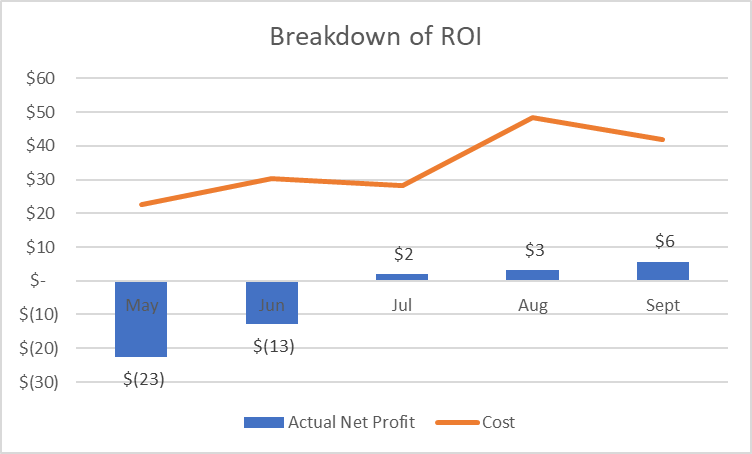
Case Study 2: Evaluate ROI and Marketing Strategies
This case study focuses on ROI to assess the profitability of your investments.
BUSINESS QUESTIONS
- How profitable are my investments?
- Where should I invest my money next?
KPIs
- ROI
RULE OF THUMB
- Evaluate the ROI trend.
- Identify causes.
- Deep dive to extract insights.
USE CASE:
If you notice that ROI increased from one month to another, (e.g. May to June), where ROI improved despite both months showing negative profits, it signals that the investments or strategies implemented in June were more effective in reducing losses. In this case, it is essential to investigate where the improved ROI came from, like examining which marketing channels or product strategies were more successful.
Whereas, if ROI remains consistent or decreases, (e.g. July to August), it is time to question the efficiency of specific investments. For instance, if you notice Etsy Ads contributing significantly to costs with minimal return, it may be an opportunity to reallocate your budget and focus on more profitable marketing channels.
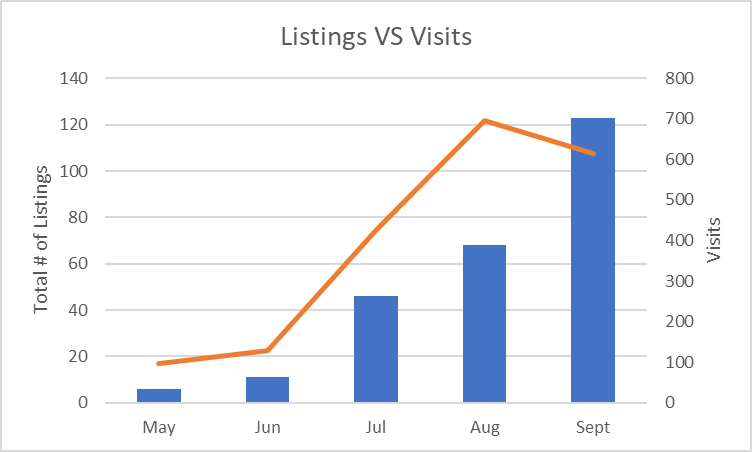
Case Study 3: Explore Listing and Visits
In this case, we examine the correlation between the number of product listings and customer visits.
BUSINESS QUESTIONS
- Where should I focus more time on?
- How can I use my time more wisely?
KPIs
- Total # of Listings
- Visits
RULE OF THUMB
- Review the overall trend of listings and visits.
- Explain the trends.
- Draw insightful conclusions.
USE CASE:
In July, both listings and visits saw a substantial increase. This suggests that investing in listings and driving more traffic to our store through these listings can lead to growth.
In August, similar trends continue, with both listings and visits rising, but at a slower pace. However, in August, the shop introduced an aggressive sales strategy, which did not generate as much increase as anticipated, hinting that it may not be as effective. This prompts us to consider shifting strategies or experimenting with new approaches to maintain our growth momentum.
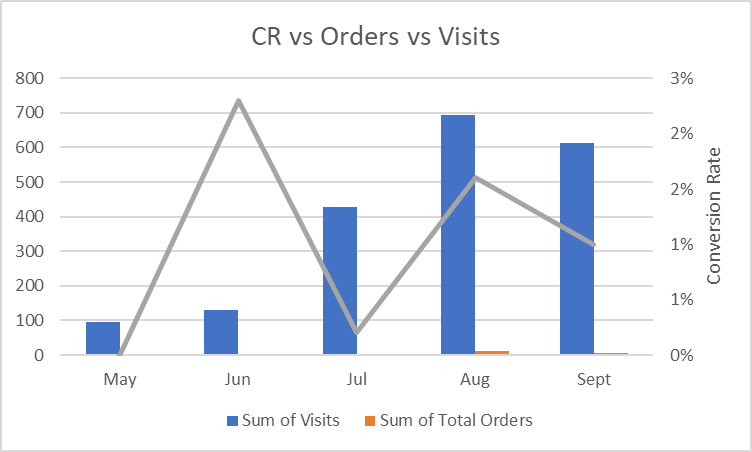
Case Study 4: Assess Conversion Rate
This case study delves into Conversion Rate (CR) to evaluate the effectiveness of our product pages and marketing campaigns.
BUSINESS QUESTIONS
- Which product is driving the most sales?
- What kind of products are driving the highest conversions?
- What product strategy should I adopt?
KPIs
- CR
- Orders
- Visits
RULE OF THUMB
- Analyse the overall trend.
- Identify the causes.
- Deep dive for insights
USE CASE:
In July, a significant drop in conversion rate was observed despite an increase in visits, coupled with a decrease in orders. Further analysis revealed that this drop could be attributed to the substantial investment in Etsy Ads, listing ads, and miscellaneous fees. This situation prompts two considerations:
- Rethink the allocation of marketing dollars. It could be either insufficient or excessive. Testing different daily budgets could provide more insights.
- Etsy Ads seems to be bringing people to the product pages but they are not converting. This suggests that there is room for optimization on the product pages such as thumbnail images and descriptions.
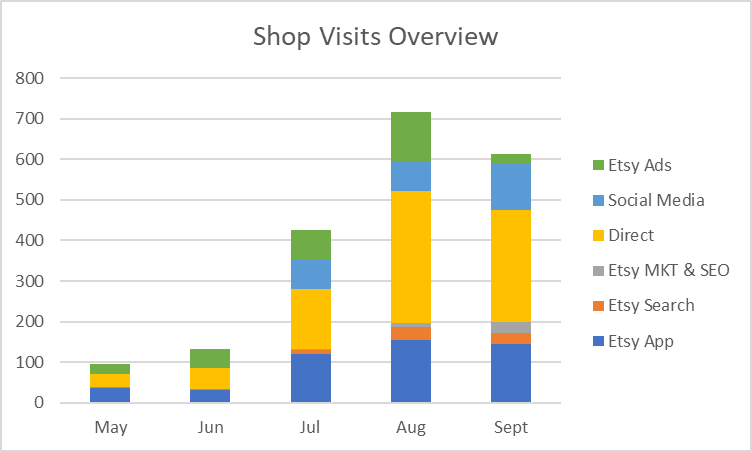
Case Study 5: Analyse Marketing Channel Effectiveness
In Case Study 5, we focus on analyzing the effectiveness of various marketing channels in driving visits to our shop.
BUSINESS QUESTIONS
- How effective are my marketing efforts?
- Where should I invest more of my marketing dollars?
KPIs
- Breakdown of Visits by Traffic Source
RULE OF THUMB
- Examine the overall trend.
- Deep dive into specific channels.
- Ensure that the outcomes align with your efforts.
USE CASE:
Let’s take August as an example where visits increased significantly due to Etsy Ads, Direct, and Etsy App. In this scenario, my focus will be to dig deeper into my marketing efforts within these channels and assess whether the number of visits aligns with the effort I’ve invested. This analysis helps me determine the effectiveness of my strategies for each channel. If I notice a particular channel where I have dedicated a lot of time and effort, yet the visits don’t match my expectations, it is a clear sign that I need to reevaluate and refine my marketing approach for that channel.
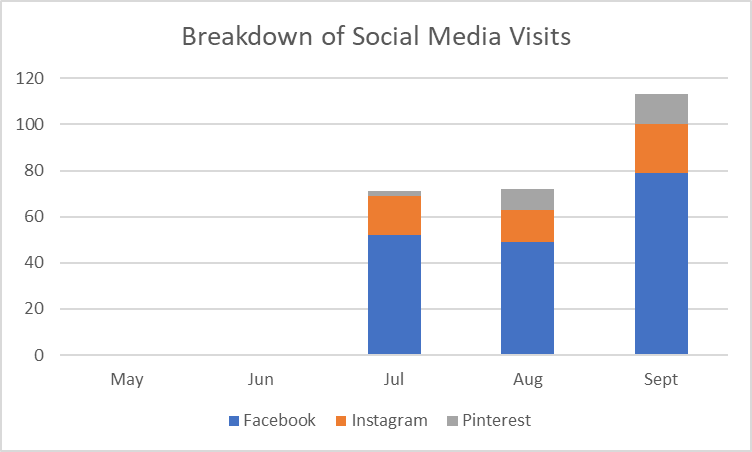
Case Study 6: Explore Social Media Impact on Shop Visits
In Case Study 6, we focus on the performance of social media channels in driving visits to the Etsy shop.
BUSINESS QUESTIONS
- Where should I spend my resources and manpower?
- Which social media platform should I focus on?
KPIs
- Social Media Visits (Facebook, Instagram, and Pinterest)
RULE OF THUMB
- Examine the overall trend.
- Deep dive into specific channels.
- Verify that the outcomes correspond to your efforts.
USE CASE:
In September, visits from all social media platforms increased, signaling that the efforts invested in these channels are producing positive outcomes. My next step will be to conduct a detailed analysis of the specific posts and pins that performed exceptionally well and drove the visits.
The objective is to understand the types of content that resonate with our audience and which products pique their interest. This insight will enable us to create high-performing pins and posts consistently, align our product offerings with customer expectations, and maximise the impact of our social media marketing efforts.
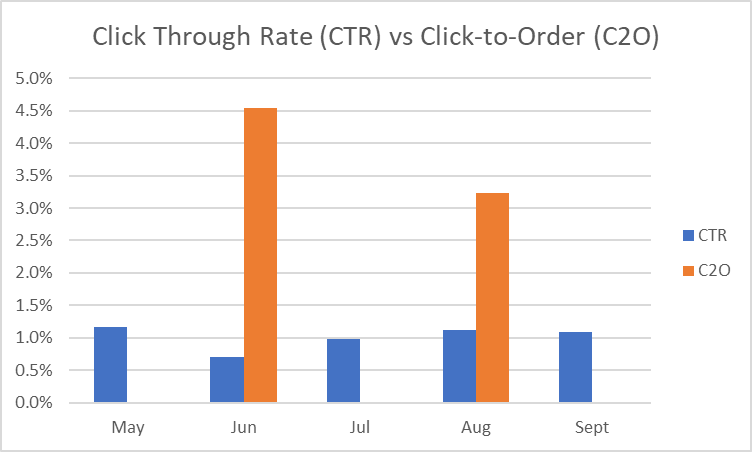
Case Study 7: Analyse CTR and C2O
In Case Study 7, we explore Click-Through Rate (CTR) and Conversion Rate (C2O) to gain insights into the effectiveness of thumbnail images and product pages.
BUSINESS QUESTIONS
- How should I improve my product pages?
- Are my thumbnail pictures effective compared to competitors?
KPIs
- CTR
- C2O
RULE OF THUMB
- Observe the drop-off from impressions to clicks to conversions.
- Identify the overall trend for CTR and C2O.
- Compare CTR to C2O.
USE CASE:
Consistently observing a high CTR combined with a low C2O may suggest that customers are initially attracted by the thumbnail images but are not finding what they expect on the product pages. This situation may indicate the need for optimization in product descriptions, imagery, or other content elements.
Whereas, if the CTR is consistently low, it might be time to revisit the thumbnail images.
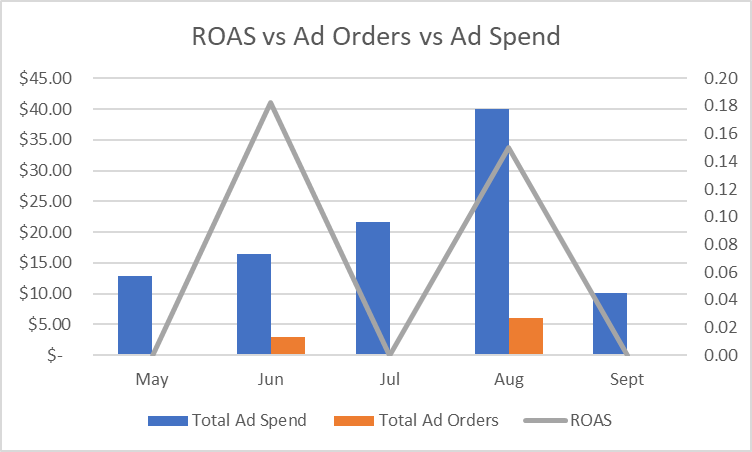
Case Study 8: Optimize Etsy Ads ROAS
In Case Study 8, we zero in on the Return on Ad Spend (ROAS) from Etsy Ads, a vital metric for evaluating the effectiveness of our investments.
BUSINESS QUESTIONS
- Should I continue investing in Etsy Ads?
- How much should I invest in Etsy Ads?
KPIs
- ROAS (Return on Ad Spend)
- Ad Orders
- Ad Spend
RULE OF THUMB
- Identify the ROAS trend
- Assess the relationship between Ad Orders and Ad Spend
USE CASE:
When comparing June and August, we notice a fascinating pattern. In June, the shop invested approximately $15 to achieve a ROAS of 0.18, while in August, a higher investment of around $40 only resulted in a ROAS of 0.16.
This insight reveals that increasing ad spend does not necessarily yield proportional returns. This suggests the importance of reevaluating the ROI in Etsy Ads, especially when allocating additional marketing budgets leads to minimal gains. Reallocating the budget to more profitable marketing channels may be a more prudent strategy to maximise returns and maintain a cost-efficient marketing approach.
[BONUS] Uncover Additional Insights with Etsy Stats
Apart from the previously mentioned statistics, Etsy offers more avenues for in-depth analysis that can provide valuable insights into your shop’s performance.
(1) Traffic Details
To access this data, navigate to Stats and select “How Shoppers Found You.” Depending on the channel you choose, you’ll have access to the following information:
- Most Visited Listings
- Search Terms
- Search Engine Breakdown
- Traffic Source Breakdown
These insights offer a deeper understanding of customer behavior. You can discover the specific keywords customers are using to find your products, which listings attract the most attention, and where your visitors are coming from.
(2) Search Analytics
Located under Marketing > Search Analytics, you will find numerous key performance indicators (KPIs) to help you identify the most relevant keywords for your potential customers.
My approach involves filtering results by Conversion Rate, Revenue, Average Order Value (AOV), and Visits per Impression. This comparison allows me to pinpoint opportunities for improving SEO keywords on my listings.
Additionally, examining visits per impression indicates whether the selected keywords are relevant and whether your thumbnail images are optimized for products associated with these keywords.
By leveraging these advanced Etsy Stats tools, you can gain deeper insights, fine-tune your SEO strategy, and make data-driven decisions to boost your shop’s performance.

SKIP THE 4-FIGURE ETSY COURSE
The Etsy Setup Toolbox is your shortcut to a fully set-up and thriving Etsy shop. Get easy-to-follow steps, SEO tips, copy-paste scripts, and Canva templates designed to help you launch and grow fast.
Set up your Etsy shop the smart way and drive traffic to your shop today!
Explore Related Resources
If you have read this far, you are dedicated to leveling up your Etsy game. Here are some resources to assist you in your journey.
- Data Science for Business: What You Need to Know about Data Mining and Data-Analytic Thinking by Foster Provost and Tom Fawcett
- Influence, New and Expanded: The Psychology of Persuasion by Robert B. Cialdini
- Why We Buy: The Science of Shopping by Paco Underhill
- Lean Analytics: Use Data to Build a Better Startup Faster by Alistair Croll and Benjamin Yoskovitz
- Revenue Management: Hard-Core Tactics for Market Domination by Robert G. Cross
Embracing data-driven decision-making is essential, but remember that one size doesn’t fit all. Each shop is unique, and there’s no one-size-fits-all approach to success. So experiment and learn what resonates with your audience and yields the best results. Conduct consistent monthly analyses to fine-tune your strategies, adapt to changing trends, and stay ahead of the competition.
This post is all about analysing Etsy Sales Data with Etsy Analysis Tool.
If you love to see more content like this, connect & follow me on social media to stay updated with the latest information.
Other posts you may like:
- 6 Clever Hacks to Use AI for Etsy Shop
- 11 Fast & Easy Steps to upload digital files to Etsy
- How to optimise your Etsy Listing for Digital Products?

Your Monthly Permission Slip to Play
Open a monthly bundle of keepsakes and a nostalgic time-capsule activity designed to give you a tiny, analog escape.


